
Date: Sat, Jan 03, 2026 | 06:10 AM GMT
As the 2026 kicks off, the broader cryptocurrency market is showing renewed stability. Bitcoin (BTC) and Ethereum (ETH) are both trading slightly in the green, with ETH posting gains of over 3% today. This steady performance among major assets has helped improve overall market sentiment, allowing select altcoins — including Bitcoin Cash (BCH) — to form constructive technical setups.
Bitcoin Cash is already responding positively, jumping nearly 5% on the day. However, beyond the short-term price move, the daily chart reveals a much more important development. BCH appears to be completing a classic reversal structure, hinting that the recent strength may be the early stage of a larger trend shift rather than just a temporary bounce.
Rounding Bottom in Play?
On the daily timeframe, Bitcoin Cash is forming a rounding bottom pattern, a well-known bullish reversal formation that signals a gradual transition from selling pressure to sustained accumulation. Unlike sharp V-shaped reversals, rounding bottoms reflect patience from buyers and fading control from sellers over an extended period.
This structure began taking shape after BCH faced a strong rejection near the $630 level in September 2025. That rejection triggered a sharp sell-off, pushing price down to the $446.9 region. Crucially, bears failed to force a deeper breakdown. Instead, strong demand emerged, price stabilized, and volatility gradually compressed — laying the foundation for the rounded base visible on the chart.
As weeks passed, BCH began to print higher lows, slowly curving upward and completing the bottoming structure. The recovery has now brought price back toward the $600–$630 resistance zone, which marks the neckline of the rounding bottom and represents a key decision area for the trend.

Key Resistance in Focus
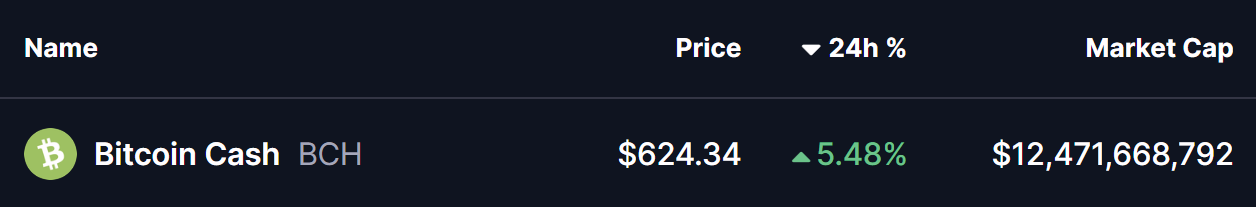
At present, BCH is trading near $624, repeatedly testing the $600–$630 zone. This area has historically acted as a supply zone, rejecting price advances multiple times in the past. A decisive daily close above this range would confirm a bullish breakout and signal a shift in market structure.
If bulls manage to push through this resistance and flip it into support, it would strongly validate the rounding bottom pattern and open the door for a continuation rally.
What’s Next for BCH?
A confirmed breakout above $630, followed by a successful retest of the zone as support, would significantly strengthen the bullish outlook. Based on the depth of the rounding bottom formation, the measured upside target points toward the $800–$820 region.
Reaching that level would represent a potential upside of approximately 27% from current prices, aligning well with historical behavior following similar rounding bottom breakouts.
That said, patience remains essential. Before a clean breakout occurs, BCH could still see short-term pullbacks — potentially toward the rising base of the rounded structure or near-term moving averages, which have acted as dynamic support during the recovery. Such retracements would not invalidate the bullish setup as long as price continues to hold above higher low levels.
For now, the $600–$630 zone remains the line in the sand. How BCH behaves around this resistance in the coming sessions will likely determine whether it enters a sustained bullish phase or remains range-bound a bit longer.
Disclaimer: The views and analysis presented in this article are for informational purposes only and reflect the author’s perspective, not financial advice. Technical patterns and indicators discussed are subject to market volatility and may or may not yield the anticipated results. Investors are advised to exercise caution, conduct independent research, and make decisions aligned with their individual risk tolerance.
About Author: Nilesh Hembade is the Founder and Lead Author of Coinsprobe, with over 5 years of experience in the cryptocurrency and blockchain industry. Since launching Coinsprobe in 2023, he has been providing daily, research-driven insights through in-depth market analysis, on-chain data, and technical research.
The opinions and market insights shared on CoinsProbe represent the views of individual authors based on prevailing market conditions at the time of publication. Cryptocurrency investments carry significant risk and volatility. Readers are encouraged to conduct their own research and seek professional financial advice before making investment decisions. CoinsProbe and its contributors do not accept responsibility for financial losses or decisions made based on published content.
CoinsProbe may publish sponsored articles, affiliate links, or promotional collaborations. All sponsored material is clearly labeled to maintain transparency with our audience. Our editorial decisions remain fully independent, and advertising partnerships do not influence reviews, rankings, or published opinions.
Since 2023, CoinsProbe has delivered reliable insights on cryptocurrency, blockchain, and digital assets. Our content is created by experienced researchers and analysts who follow strict editorial standards focused on accuracy, transparency, and credibility. Every article is carefully reviewed and verified using trusted sources and current market data. We provide unbiased analysis and timely updates covering everything from emerging crypto projects to major industry developments.